TapData#
- class msfc_ccd.TapData(inputs, outputs, camera, *, axis_x='detector_x', axis_y='detector_y')[source]#
Bases:
AbstractTapDataAn image or a sequence of images captured from each tap of the sensor.
Examples
Load a sample image and split it into the four tap images.
import named_arrays as na
import msfc_ccd

# Load the sample image
image = msfc_ccd.fits.open(msfc_ccd.samples.path_fe55_esis1)

# Split the sample image into four separate images for each tap
taps = image.taps

# Display the four images
fig, axs = na.plt.subplots(
    axis_rows=taps.axis_tap_y,
    nrows=taps.outputs.shape[taps.axis_tap_y],
    axis_cols=taps.axis_tap_x,
    ncols=taps.outputs.shape[taps.axis_tap_x],
    sharex=True,
    sharey=True,
    constrained_layout=True,
);
na.plt.pcolormesh(
    taps.inputs.pixel,
    C=taps.outputs.value,
    ax=axs,
);
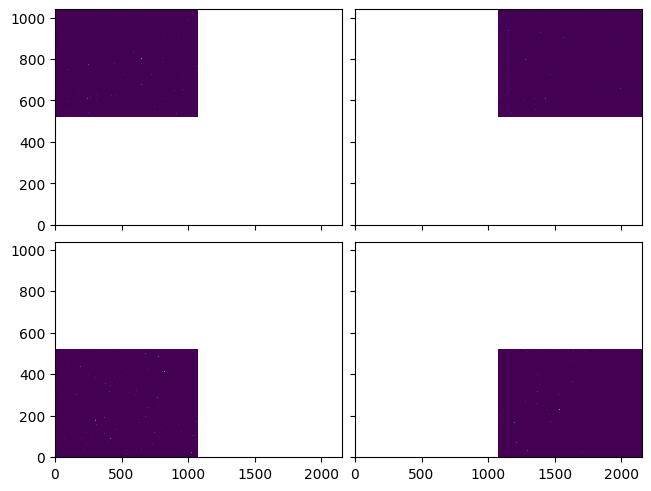
Attributes
A new copy of these images without the bias and overscan columns.
The name each tap is known by.
A
tupleofstrrepresenting the names of each dimension of this array.Return keys corresponding to all input axes representing bin centers
Return keys corresponding to all input axes representing bin vertices
The name of the horizontal tap axis.
The name of the vertical tap axis.
The name of the horizontal axis.
The name of the vertical axis.
if this array has multiple components, broadcast them against each other.
A model of the camera used to capture these images.
Remove cosmic rays using
astroscrappy.detect_cosmics().A new copy of these images in units of electrons.
Converts this array to an instance of
named_arrays.AbstractExplicitArray.Compute the index of each element of this array.
A vector which contains the FITS header for each image.
Human-readable name of the tap used often for plotting.
L2-norm of this array.
Number of dimensions of the array.
The number of pixels along the horizontal axis.
The number of pixels along the vertical axis.
The underlying array storing the image data.
The number of elements along each axis of the array.
Total number of elements in the array.
The 2-dimensional index of the tap corresponding to each image.
The
named_arrays.AbstractArraytype corresponding to this array.The
named_arrays.AbstractExplicitArraytype corresponding to this array.A new copy of these images where the bias has been removed.
Returns a new array with its units removed, if they exist.
Methods
__init__(inputs, outputs, camera, *[, ...])add_axes(axes)Add new singleton axes to this array.
all([axis, where])Return
Trueif all of the elements along the given axes areTrue.any([axis, where])Return
Trueif any of the elements along the given axes areTrue.astype(dtype[, order, casting, subok, copy])Copy of the array cast to a specific data type.
bias([num_blank, num_overscan])Compute the bias (or pedestal) for each tap.
broadcast_to(shape[, append])A new view of this array with the specified shape.
cell_centers([axis, random, seed])Convert an array from cell vertices to cell centers.
combine_axes([axes, axis_new])Combine some of the axes of the array into a single new axis.
copy()Create a deep copy of this array.
Create a shallow copy of this array.
debroadcast([axes])Remove redundant axes introduced by broadcasting.
from_scalar_array(a[, like])Constructs a new version of this array using
aas the underlying data.hits([threshold, threshold_split])Find the isolated single-pixel events in each image.
index(value[, axis])index_secant(value[, axis])integrate(axis[, component])Integrate the outputs over the given input
axisor axes.interp_linear(item)Linearly interpolate this array to find its value at the given fractional index.
isel(**item)Index this array along named axes given as keyword arguments.
max([axis, initial, where])The maximum value of this array along the given axes.
mean([axis, where])The mean value of this array along the given axes.
median([axis])The median value of this array along the given axes.
min([axis, initial, where])The minimum value of this array along the given axes.
ndindex([axis_ignored])An iterator that yields the index of each element of this array.
pcolormesh(axs, input_component_x, ...[, ...])Plot a
FunctionArrayviamatplotlib.pyplot.pcolormesh().percentile(q[, axis, out, overwrite_input, ...])The requested percentile of this array along the given axes.
ptp([axis])The peak-to-peak value of this array along the given axes.
regrid(inputs[, axis, method, weights])Resample this function array onto a new set of input coordinates using
named_arrays.regridding.regrid().replace(**changes)A method version of
dataclasses.replace()for named arrays.reshape(shape)Reorganize this array into a new shape.
rms([axis, where])The root-mean-square of this array along the given axes.
std([axis, where])The standard deviation of this array along the given axes.
sum([axis, where])The sum of each element of this array along the given axes.
take_along_axis(indices, axis)Take values from this array by matching
indicesalongaxis.to(unit[, equivalencies, copy])Convert this array to a new unit.
to_string([prefix, multiline])Convert this array instance to a string representation.
to_string_array([format_value, format_unit, ...])Convert to an array of strings where each string has an appropriately-formatted unit attached to the value.
to_value(unit[, equivalencies])The numerical value of this array, possibly in a different unit.
transpose([axes])Reorder the axes of this array to the given sequence.
var([axis, where])The variance of this array along the given axes.
vmr([axis, where])The variance-to-mean ratio of this array along the given axes.
volume_cell(axis)Computes the n-dimensional volume of each cell formed by interpreting this array as a logically-rectangular grid of vertices.
weights(inputs[, axis, method])Compute the resampling weights of this array using
named_arrays.regridding.weights().where_blank([num])Create a boolean array which is
Truefor all the blank columns.Create a boolean array which is
Truefor all the masked rows.where_overscan([num])Create a boolean array which is
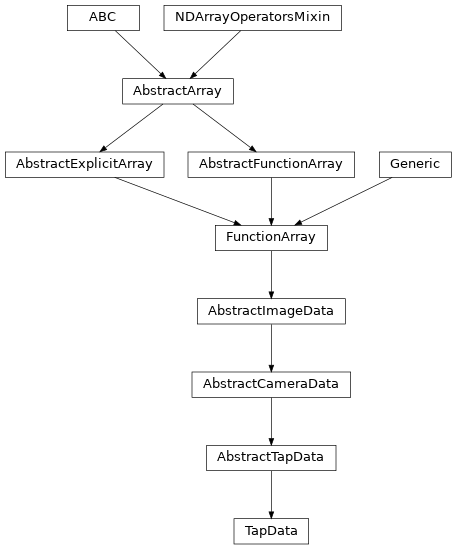
Truefor all the overscan columns.Inheritance Diagram
- Parameters:
inputs (ImageHeader)
outputs (ScalarArray)
camera (AbstractCamera)
axis_x (str)
axis_y (str)
- classmethod from_scalar_array(a, like=None)#
Constructs a new version of this array using
aas the underlying data.- Parameters:
a (float | Quantity | AbstractScalarArray) – Anything that can be coerced into an instance of
named_arrays.AbstractScalarArray.like (None | Self) – Optional reference object. If provided, the result will be defined by this object.
- Return type:
- add_axes(axes)#
Add new singleton axes to this array.
- Parameters:
axes (str | Sequence[str]) – Either a single axis name or a sequence of axis names add to this array.
- Return type:
See also
named_arrays.add_axes()A functional version of this method.
- all(axis=None, where=<no value>)#
Return
Trueif all of the elements along the given axes areTrue.- Parameters:
- Return type:
See also
numpy.all()A functional version of this method.
- any(axis=None, where=<no value>)#
Return
Trueif any of the elements along the given axes areTrue.- Parameters:
- Return type:
See also
numpy.any()A functional version of this method.
- astype(dtype, order='K', casting='unsafe', subok=True, copy=True)#
Copy of the array cast to a specific data type.
Equivalent to
numpy.ndarray.astype().
- bias(num_blank=25, num_overscan=0)#
Compute the bias (or pedestal) for each tap.
Select a number of blank pixels and a number of overscan pixels and take the mean to compute the bias.
By default, only the 25 blank columns closest to the active pixels are used. The blank columns are read out before any of the active pixels, so they are not affected by the signal in the image, and the first half of the blank columns is ignored since it contains a transient from the start of each row. The overscan columns are not used by default since they contain charge deferred from the last active pixels in each row, which makes the bias depend on the brightness of the image.
The blank columns are offset from the dark level of the active pixels by up to about 1 DN, and this offset is different for each tap. This offset is constant in time, so it is removed if a dark image prepared using the same bias is subtracted from the result.
- Parameters:
num_blank (None | int) – The number of blank columns to use starting from those closest to the active pixels. If
None, all the blank pixels are used.num_overscan (None | int) – The number of overscan columns to use starting from those closest to the active pixels. If
None, all the overscan pixels are used.
- Return type:
Relevant Reports
- broadcast_to(shape, append=False)#
A new view of this array with the specified shape.
- Parameters:
- Return type:
See also
named_arrays.broadcast_to()A functional version of this method.
- cell_centers(axis=None, random=False, seed=None)#
Convert an array from cell vertices to cell centers.
- Parameters:
axis (None | str | Sequence[str]) – The axes of the array to average over.
random (bool) – If true, select a random point within each cell instead of the geometric center.
seed (None | int) – The seed of the random sampling, which has an effect only where
randomis true. IfNone(the default), the sampling differs from one call to the next, and anything computed from it cannot be reproduced.
- Return type:
- combine_axes(axes=None, axis_new=None)#
Combine some of the axes of the array into a single new axis.
- debroadcast(axes=None)#
Remove redundant axes introduced by broadcasting.
- Parameters:
- Return type:
See also
named_arrays.debroadcast()A functional version of this method.
- hits(threshold=5, threshold_split=None)#
Find the isolated single-pixel events in each image.
An \(^{55}\text{Fe}\) X-ray, or a cosmic ray arriving close to normal incidence, deposits its charge in one pixel and the pixels immediately around it. This method finds every pixel more than threshold readout noises above the dark level whose eight neighbors are all below that level, and measures the charge of the event as the sum of the \(3 \times 3\) region centered on it.
The result has the shape of
active, with the charge of each event in the pixel where it landed andnumpy.naneverywhere else, so a sequence of images can be pooled by taking a histogram along the sequence axis and the two detector axes.The bias is removed, and then the median of the active pixels, which removes the dark current and the fixed pattern of the sensor to the accuracy needed to place the threshold.
- Parameters:
threshold (float) – How many readout noises above the dark level a pixel must be to start an event. The readout noise is estimated from the median absolute deviation of the active pixels, which is not moved by the events themselves.
threshold_split (None | float) – If given, keep only the single-pixel events, whose eight neighbors are all less than this many readout noises above the dark level, and measure the charge of each as that of the center pixel alone. This is what
msfc_ccd.cte.fe55()needs, since the sum over the \(3 \times 3\) region would recover the charge that an imperfect transfer leaves in a neighboring pixel.
- Return type:
Examples
Plot the distribution of event charges for one tap of the ESIS channel 3 camera. The peak is the \(^{55}\text{Fe}\) K-\(\alpha\) line, and the tail below it is the events which lost part of their charge.
import matplotlib.pyplot as plt
import astropy.units as u
import named_arrays as na
import msfc_ccd

# Load a sample Fe 55 image and split it into taps
image = msfc_ccd.fits.open(msfc_ccd.samples.path_fe55_esis3)
taps = image.taps

# Find the isolated events
hits = taps.hits()

# Pool them into a histogram for each tap
hist = na.histogram(
    a=hits.outputs,
    bins={"charge": 26},
    axis=hits.axis_xy,
    min=0 * u.DN,
    max=800 * u.DN,
)

fig, ax = plt.subplots(constrained_layout=True)
na.plt.stairs(
    hist.inputs[{"tap_x": 0, "tap_y": 0}],
    hist.outputs[{"tap_x": 0, "tap_y": 0}],
    axis="charge",
    ax=ax,
    baseline=None,
)
ax.set_xlabel("charge in the 3x3 region (DN)")
ax.set_ylabel("number of events");
- index(value, axis=None)#
- index_secant(value, axis=None)#
- integrate(axis, component=None)#
Integrate the outputs over the given input
axisor axes.The differential measure is computed from the inputs via
AbstractArray.volume_cell():If
componentisNone, the whole input is used as the integration variable andlen(axis)must match the dimensionality of the inputs (one for a scalar, two for aCartesian2dVectorArray, etc.).If
componentis astr, that named sub-element of the inputs (a scalar or a sub-vector) supplies the measure, andlen(axis)must match its dimensionality.
A vertex axis (where the inputs represent bin edges) is integrated with a Riemann sum, while a center axis (where the inputs represent samples) is integrated with the trapezoidal rule; mixing the two in a single call is supported. The integrated axes are removed from the outputs and collapsed in the inputs by averaging.
- Parameters:
- Return type:
Examples
Integrate a constant function over a 1D domain.
import numpy as np
import astropy.units as u
import named_arrays as na

f = na.FunctionArray(
    inputs=na.ScalarLinearSpace(0, 2, axis="x", num=101) * u.nm,
    outputs=na.ScalarArray(np.full(101, 3.0), axes=("x",)) * u.ph,
)

f.integrate("x")
FunctionArray(
    inputs=ScalarArray(
        ndarray=1. nm,
        axes=(),
    ),
    outputs=ScalarArray(
        ndarray=6. nm ph,
        axes=(),
    ),
)
- interp_linear(item)#
Linearly interpolate this array to find its value at the given fractional index.
- Parameters:
item (dict[str, AbstractArray]) – A fractional index at which to evaluate the array.
- Return type:
- isel(**item)#
Index this array along named axes given as keyword arguments.
This is a convenience wrapper around
__getitem__():a.isel(x=0)is equivalent toa[dict(x=0)].Since keyword-argument names must be valid Python identifiers, axes whose names are not valid identifiers can only be indexed using the
dictform,a[{...}].- Parameters:
item (int | slice | AbstractArray) – The index to apply along each named axis.
self (Self)
- Return type:
- max(axis=None, initial=<no value>, where=<no value>)#
The maximum value of this array along the given axes.
- Parameters:
axis (None | str | Sequence[str]) – The logical axis or axes along which the operation is computed.
initial (_Buffer | _SupportsArray[dtype[Any]] | _NestedSequence[_SupportsArray[dtype[Any]]] | complex | bytes | str | _NestedSequence[complex | bytes | str]) – The initial value of the minimum, required if where provided.
where (Self) – An optional mask which selects which elements to be considered.
self (Self)
- Return type:
See also
numpy.max()A functional version of this method.
- mean(axis=None, where=<no value>)#
The mean value of this array along the given axes.
- Parameters:
- Return type:
See also
numpy.mean()A functional version of this method.
- median(axis=None)#
The median value of this array along the given axes.
- Parameters:
axis (None | str | Sequence[str]) – The logical axis or axes along which the operation is computed.
See also
numpy.median()A functional version of this method.
- min(axis=None, initial=<no value>, where=<no value>)#
The minimum value of this array along the given axes.
- Parameters:
axis (None | str | Sequence[str]) – The logical axis or axes along which the operation is computed.
initial (_Buffer | _SupportsArray[dtype[Any]] | _NestedSequence[_SupportsArray[dtype[Any]]] | complex | bytes | str | _NestedSequence[complex | bytes | str]) – The initial value of the minimum, required if where provided.
where (Self) – An optional mask which selects which elements to be considered.
self (Self)
- Return type:
See also
numpy.min()A functional version of this method.
- ndindex(axis_ignored=None)#
An iterator that yields the index of each element of this array.
- Parameters:
- Return type:
See also
named_arrays.ndindex()A functional version of this method.
- pcolormesh(axs, input_component_x, input_component_y, input_component_row=None, input_component_column=None, index=None, output_component_color=None, **kwargs)#
Plot a
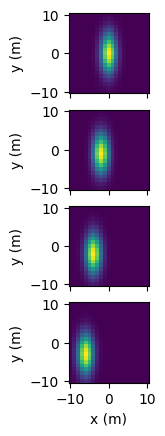
FunctionArrayviamatplotlib.pyplot.pcolormesh().FunctionArray.pcolormesh()takes in an axes object, or array of axes objects, along with components to be plotted along the x and y plot axes (input_component_xandinput_component_y). Additional components can be tiled along subplot row/column and are specified ininput_component_rowandinput_component_column.import named_arrays as na import numpy as np import astropy.units as u import matplotlib.pyplot as plt position = na.Cartesian2dVectorLinearSpace( start=-10, stop=10, axis=na.Cartesian2dVectorArray( x='position_x', y='position_y', ), num=21, ) * u.m x_width = 5 * u.m y_width = 2 * u.m velocity = 1 * u.m/u.s time = na.ScalarLinearSpace( start=0 * u.s, stop=3 * u.s, num=4, axis='time' ) intensity = np.exp(-(((position.x + velocity*time)/x_width) ** 2 + ((position.y + 2*velocity*time)/y_width)** 2)) scene = na.FunctionArray( inputs=position, outputs=intensity, ) fig, axs = plt.subplots( nrows=scene.outputs.shape['time'], squeeze=False, sharex=True, subplot_kw=dict(aspect='equal'), ) scene.pcolormesh( axs=axs, input_component_x='x', input_component_y='y', input_component_row='time', )

- percentile(q, axis=None, out=None, overwrite_input=False, method='linear', keepdims=False)#
The requested percentile of this array along the given axes.
- Parameters:
q (int | float | Quantity | Self) – The percentile to compute.
axis (None | str | Sequence[str]) – The logical axis or axes along which the operation is computed.
out (None | Self) – An optional output array in which to place the result.
overwrite_input (bool) – Whether to overwrite the input array.
method (str) – How to interpolate the result.
keepdims (bool) – A boolean flag indicating whether to keep the reduced dimensions.
self (Self)
See also
numpy.percentile()A functional version of this method.
- ptp(axis=None)#
The peak-to-peak value of this array along the given axes.
- Parameters:
- Return type:
See also
numpy.ptp()A functional version of this method.
- regrid(inputs, axis=None, method='multilinear', weights=None)#
Resample this function array onto a new set of input coordinates using
named_arrays.regridding.regrid().- Parameters:
inputs (AbstractArray) – The new input coordinates on which to resample the outputs.
axis (None | str | tuple[str]) – The logical axes of the input over which to resample.
method (Literal['multilinear', 'conservative']) – The resampling method to use.
weights (None | tuple[AbstractScalar, dict[str, int], dict[str, int]]) – Optional weights which can be computed in advance using
weights()to greatly speed repeated resampling of the same inputs.
- Return type:
See also
weights()If you need to resample the same coordinates more than once.
- replace(**changes)#
A method version of
dataclasses.replace()for named arrays.- Parameters:
changes – The fields of the dataclass to be overwritten
- Return type:
- reshape(shape)#
Reorganize this array into a new shape.
- rms(axis=None, where=<no value>)#
The root-mean-square of this array along the given axes.
- std(axis=None, where=<no value>)#
The standard deviation of this array along the given axes.
- Parameters:
- Return type:
See also
numpy.std()A functional version of this method.
- sum(axis=None, where=<no value>)#
The sum of each element of this array along the given axes.
- Parameters:
- Return type:
See also
numpy.sum()A functional version of this method.
- take_along_axis(indices, axis)#
Take values from this array by matching
indicesalongaxis.- Parameters:
indices (AbstractArray) – The integer indices to take along
axis.axis (str) – The axis of this array along which the values are taken.
self (Self)
- Return type:
See also
named_arrays.take_along_axis()A functional version of this method.
- to(unit, equivalencies=[], copy=True)#
Convert this array to a new unit.
Equivalent to
astropy.units.Quantity.to().
- to_string(prefix=None, multiline=None)#
Convert this array instance to a string representation.
- to_string_array(format_value='%.2f', format_unit='latex_inline', pad_unit='$\\,$')#
Convert to an array of strings where each string has an appropriately-formatted unit attached to the value.
- to_value(unit, equivalencies=[])#
The numerical value of this array, possibly in a different unit.
Equivalent to
astropy.units.Quantity.to_value().
- transpose(axes=None)#
Reorder the axes of this array to the given sequence.
- Parameters:
- Return type:
See also
numpy.transpose()The
numpyversion of this method.
- var(axis=None, where=<no value>)#
The variance of this array along the given axes.
- Parameters:
- Return type:
See also
numpy.var()A functional version of this method.
- vmr(axis=None, where=<no value>)#
The variance-to-mean ratio of this array along the given axes.
- volume_cell(axis)#
Computes the n-dimensional volume of each cell formed by interpreting this array as a logically-rectangular grid of vertices.
Note that this method is usually only used for sorted arrays.
If self is a scalar, this method computes the length of each edge, and is equivalent to
numpy.diff(). If self is a 2d vector, this method computes the area of each quadrilateral, and if self is a 3d vector, this method computes the volume of each cuboid.
- weights(inputs, axis=None, method='multilinear')#
Compute the resampling weights of this array using
named_arrays.regridding.weights(). The output of this method is designed to be used byregrid().- Parameters:
inputs (AbstractArray) – The new input coordinates on which to resample the outputs.
axis (None | str | tuple[str]) – The logical axes of the input over which to resample.
method (Literal['multilinear', 'conservative']) – The resampling method to use.
- Return type:
See also
regrid()A method designed to use these weights.
- where_blank(num=None)#
Create a boolean array which is
Truefor all the blank columns.
- where_masked()#
Create a boolean array which is
Truefor all the masked rows.See
msfc_ccd.TeledyneCCD230.num_maskedfor how these rows differ from the rest of the image.- Return type:
- where_overscan(num=None)#
Create a boolean array which is
Truefor all the overscan columns.
- property amplifier: ScalarArray#
The name each tap is known by.
E,F,GandHare the four output amplifiers of the sensor, named as on page 16 of the datasheet, and MSFC numbers the same four quadrants 1 to 4. Their layout across the readout frame is+-------+-------+ | 2/H | 3/G | +-------+-------+ | 1/E | 4/F | +-------+-------+
with the first row read out at the bottom, so
1/Eis(tap_y=0, tap_x=0)and3/Gis(tap_y=1, tap_x=1). This is the mapping needed to compare a per-tap measurement against the values MSFC published by quadrant number.Examples
import msfc_ccd

image = msfc_ccd.fits.open(msfc_ccd.samples.path_fe55_esis3)

image.taps.amplifier.ndarray
array([['1/E', '4/F'],
       ['2/H', '3/G']], dtype='<U3')
- property axes: tuple[str, ...]#
A
tupleofstrrepresenting the names of each dimension of this array.Must have the same length as the number of dimensions of this array.
- property axes_center: tuple(str)#
Return keys corresponding to all input axes representing bin centers
- property axes_flattened: str#
Combine
axesinto a singlestr.This is useful for functions like
numpy.flatten()which returns an array with only one dimension.
- property axes_vertex: tuple(str)#
Return keys corresponding to all input axes representing bin vertices
- property broadcasted: FunctionArray#
if this array has multiple components, broadcast them against each other.
Equivalent to
a.broadcast_to(a.shape).
- camera: AbstractCamera = <dataclasses._MISSING_TYPE object>#
A model of the camera used to capture these images.
- property despiked: Self#
Remove cosmic rays using
astroscrappy.detect_cosmics().
- property explicit: FunctionArray#
Converts this array to an instance of
named_arrays.AbstractExplicitArray.
- property indices: dict[str, ScalarArrayRange]#
Compute the index of each element of this array.
See also
named_arrays.indices()A functional version of this method.
- inputs: ImageHeader = <dataclasses._MISSING_TYPE object>#
A vector which contains the FITS header for each image.
- property label: ScalarArray#
Human-readable name of the tap used often for plotting.
- property length: FunctionArray#
L2-norm of this array.
- property ndim: int#
Number of dimensions of the array. Equivalent to
numpy.ndarray.ndim.
- outputs: ScalarArray = <dataclasses._MISSING_TYPE object>#
The underlying array storing the image data.
- property shape: dict[str, int]#
The number of elements along each axis of the array. Analogous to
numpy.ndarray.shapebut represented as adictwhere the keys are the axis names and the values are the axis sizes.
- property size: int#
Total number of elements in the array. Equivalent to
numpy.ndarray.size
- property tap: dict[str, AbstractScalarArray]#
The 2-dimensional index of the tap corresponding to each image.
- property type_abstract: Type[AbstractFunctionArray]#
The
named_arrays.AbstractArraytype corresponding to this array.
- property type_explicit: Type[FunctionArray]#
The
named_arrays.AbstractExplicitArraytype corresponding to this array.
- property value: FunctionArray#
Returns a new array with its units removed, if they exist.
The family is preserved, so a vector returns a vector and a function array returns a function array, but the result is always explicit: an implicit array materializes into its family’s explicit type.
